Models Web App
What is the KServe Models Web App?
The KServe Models Web App is a component of KServe that provides a user-friendly way to handle the lifecycle of InferenceService CRs in a Kubeflow cluster.
This allows users to create, delete, and inspect the state of their Model Servers without needing to interact with Kubernetes resources directly.
Install as part of Kubeflow
The web app has been included as a part of the kubeflow/manifests since Kubeflow 1.5 release.
It is exposed as a manu link in the Kubeflow Central Dashboard by default.
Install Standalone
Refer to the kserve/models-web-app repository for standalone installation instructions.
In this case all the resources of the web app will be installed in the kserve namespace.
Users can access the web app either via the knative-ingress-gateway.knative-serving Istio Ingress Gateway or by port-forwarding the backend.
To port-forward the backend, you can use the following commands:
# set the following ENV vars in the app's Deployment
kubectl edit -n kserve deployments.apps kserve-models-web-app
# APP_PREFIX: /
# APP_DISABLE_AUTH: "True"
# APP_SECURE_COOKIES: "False"

# expose the app under localhost:5000
kubectl port-forward -n kserve svc/kserve-models-web-app 5000:80
The following is a list of ENV var that can configure different aspects of the application.
| ENV Var | Default value | Description |
|---|---|---|
| APP_PREFIX | “/models” | Controls the app’s prefix, by setting the base-url element |
| APP_DISABLE_AUTH | “False” | Controls whether the app should use SubjectAccessReviews to ensure the user is authorized to perform an action |
| APP_SECURE_COOKIES | “True” | Controls whether the app should use Secure CSRF cookies. By default the app expects to be exposed with https |
| CSRF_SAMESITE | “Strict” | Controls the SameSite value of the CSRF cookie |
| USERID_HEADER | “kubeflow-userid” | Header in each request that will contain the username of the logged in user |
| USERID_PREFIX | "" | Prefix to remove from the USERID_HEADER value to extract the logged in user name |
Usage
The web app currently works with v1beta1 versions of InferenceService objects.
The web app exposes information from the underlying Knative resources, like Conditions from the Knative Configurations, Route and Revisions as well as live logs from the Model server pod.
Listing
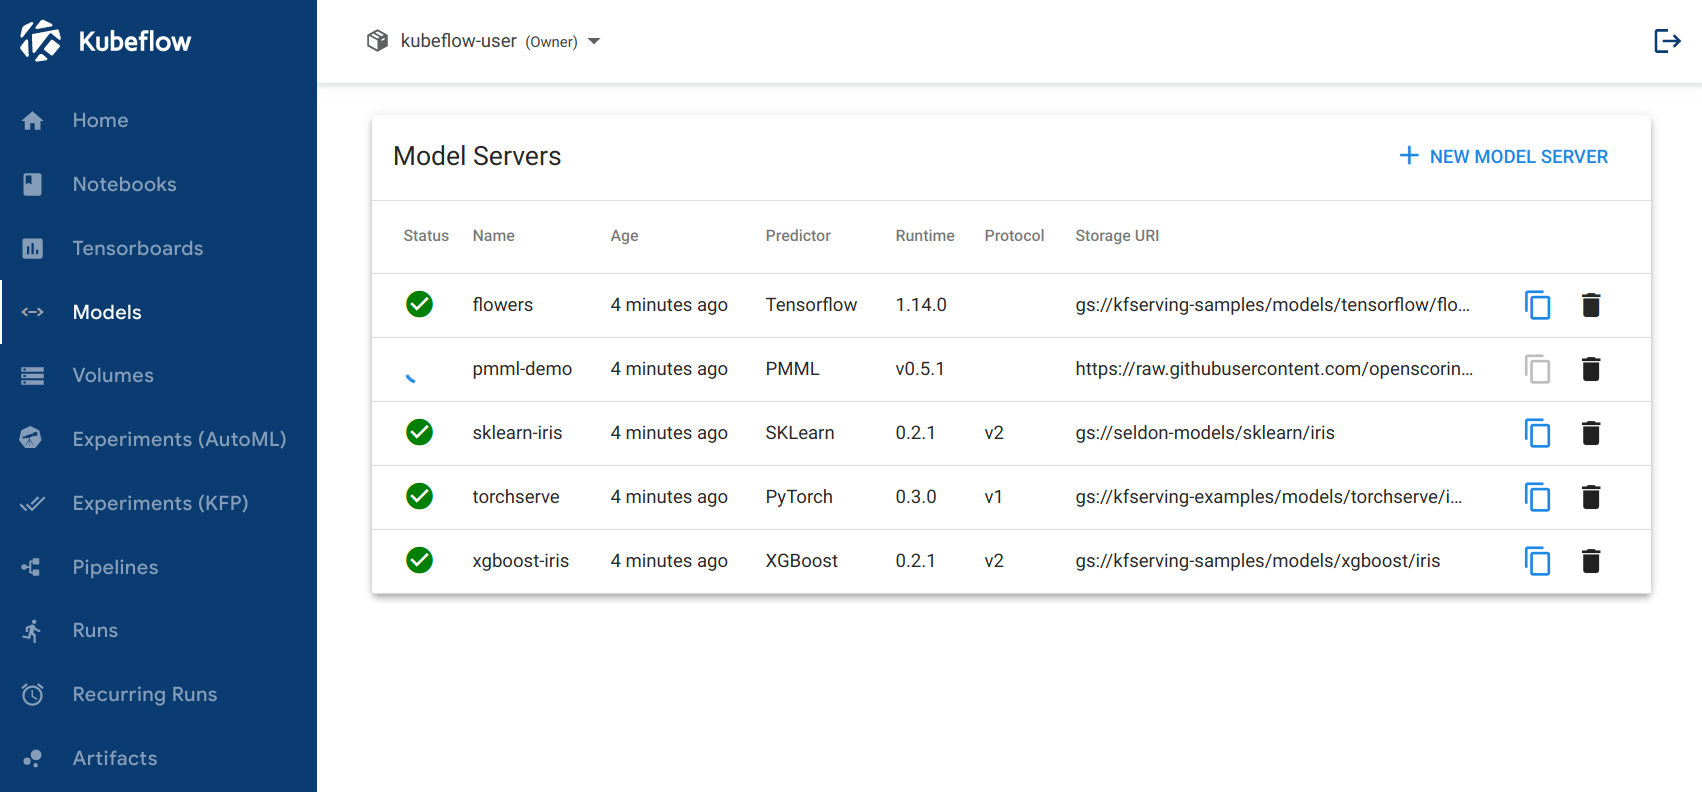
The main page of the app provides a list of all the InferenceServices that are deployed in the selected Namespace. The frontend periodically polls the backend for the latest state of InferenceServices.

Creating
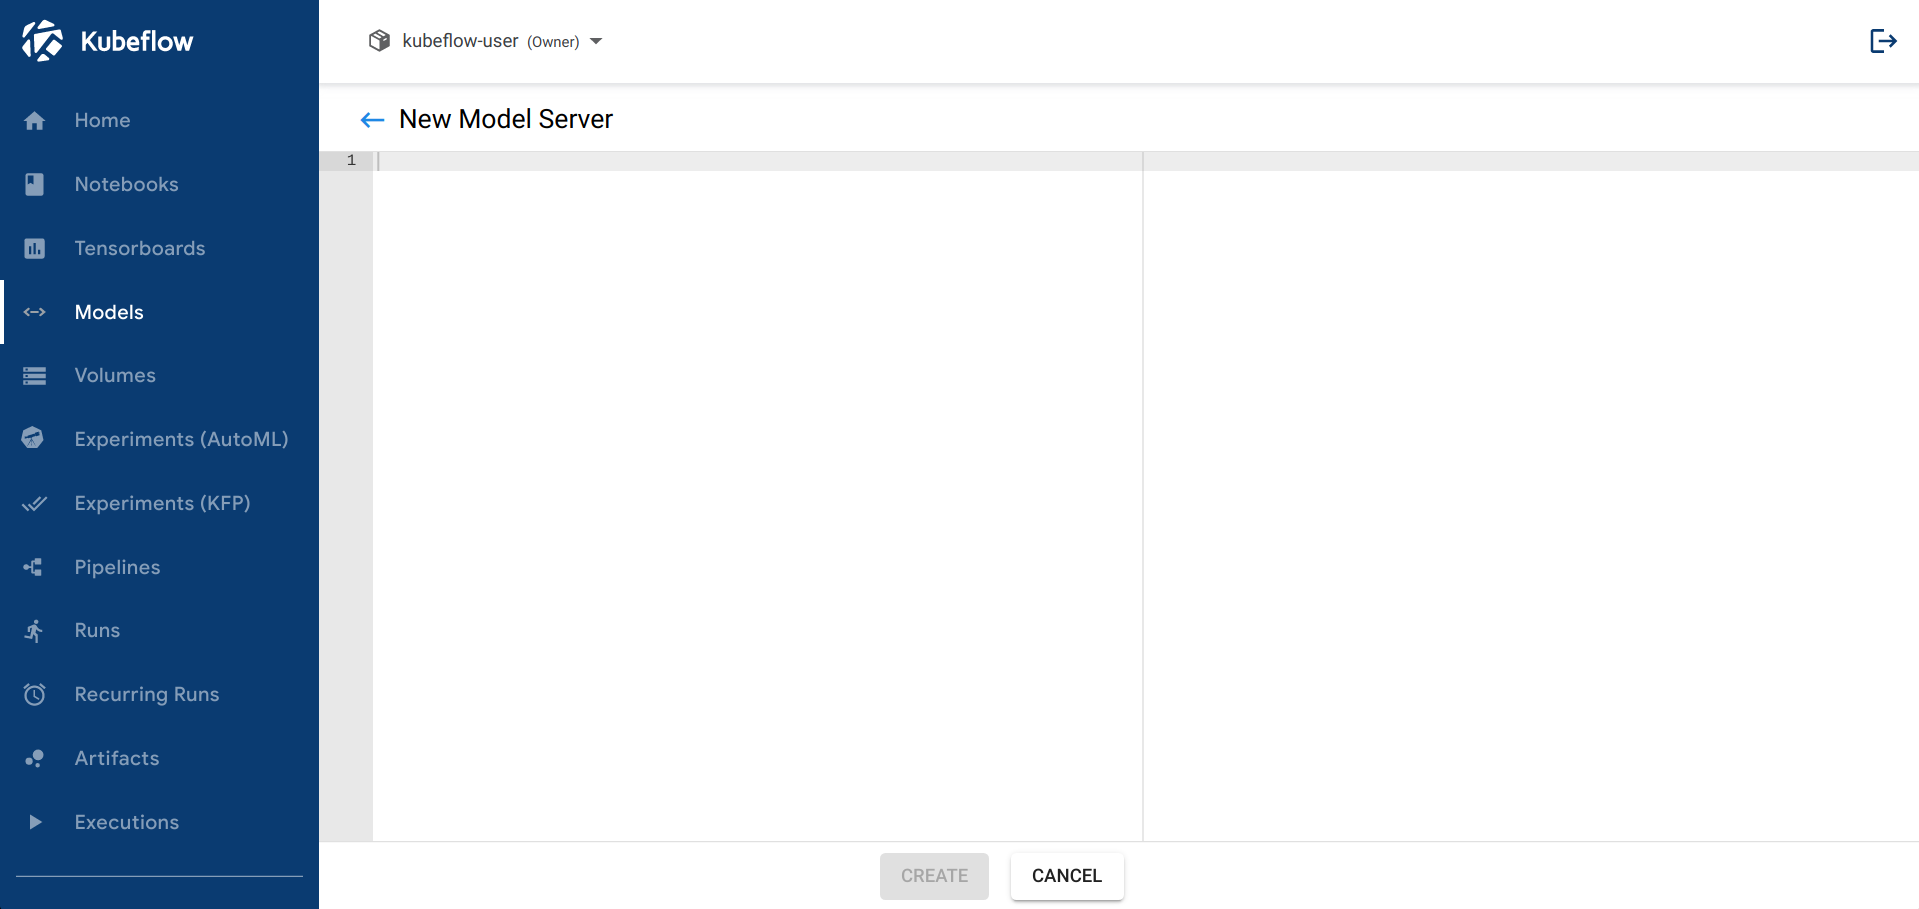
The page for creating a new InferenceService. The user can paste the YAML object of the InferenceService they wish to create.
Note that the backend will override the provided .metadata.namespace field of the submitted object, to prevent users from trying to create InferenceServices in other namespaces.

Deleting
Users can delete an existing InferenceService by clicking on the icon next to an InferenceService, in the main page that lists all the namespaced resources.
Note
The backend is using foreground cascading deletion when deleting an InferenceService. This means that the InferenceService CR will be deleted from the K8s API Server only once the underlying resources have been deleted.Inspecting
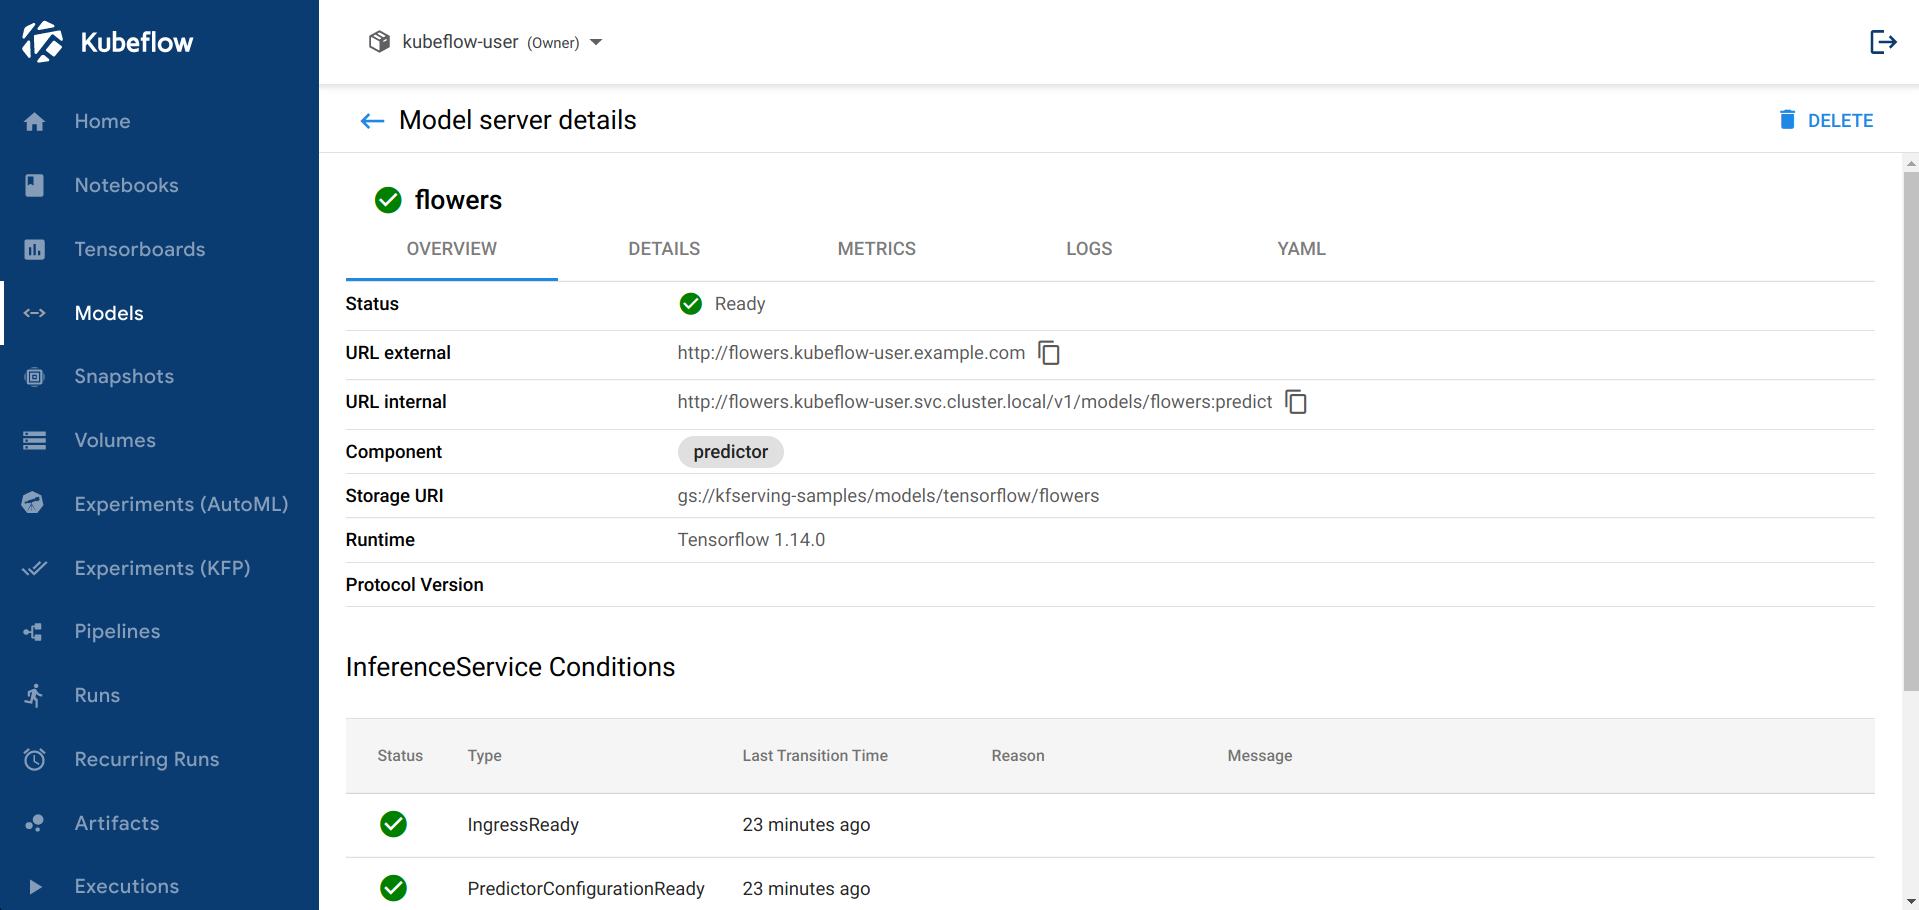
Users can click on the name of an InferenceService, from the main page, and view a more detailed summary of the CR’s state.

Note
To gather the logs the backend will:
- Filter all the pods that have a
serving.knative.dev/revisionlabel - Get the logs from the
kserve-container
Metrics
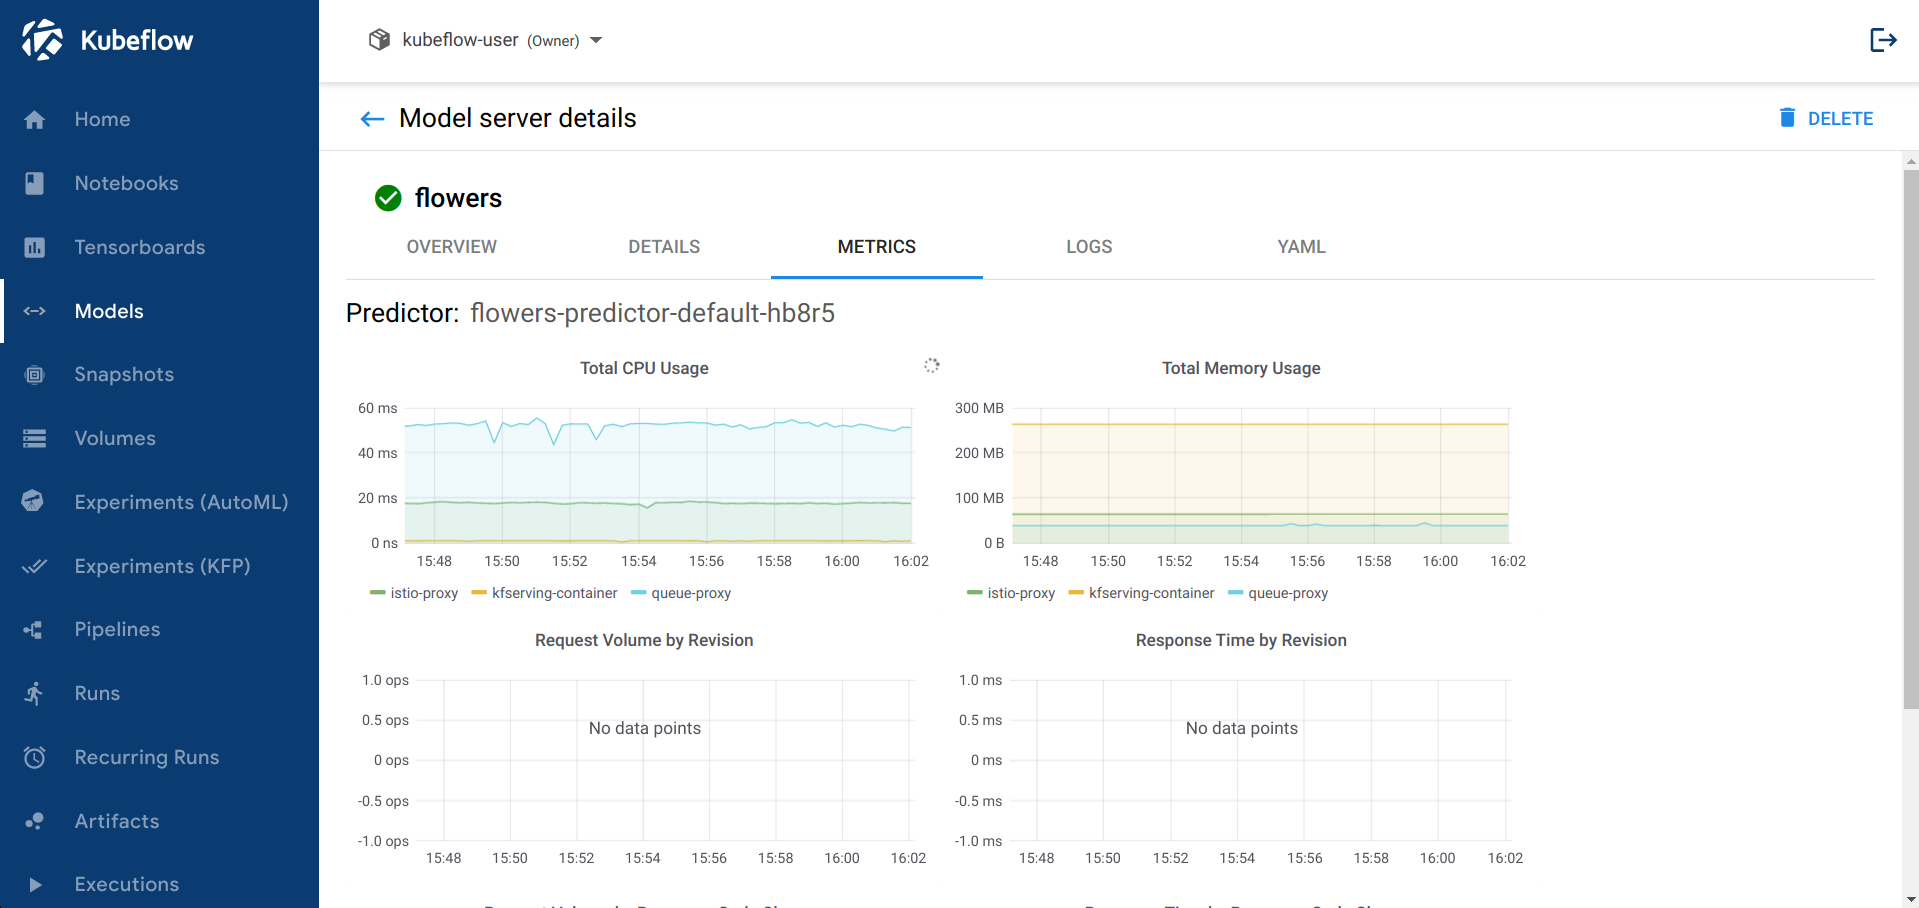
As mentioned in the above sections the web app allows users to inspect the metrics from the InferenceService. This tab will not be enabled by default. In order to expose it the users will need to install Grafana and Prometheus.
Currently, the frontend is expecting to find a Grafana exposed in the /grafana prefix.
This Grafana instance will need to have specific dashboards in order for the app to embed them in iframes.
We are working on making this more generic to allow people to expose their own graphs.
You can install Grafana and Prometheus, for the web app to consume, by installing:
- the
monitoring-core.yamlandmonitoring-metrics-prometheus.yamlfiles from the Knative 0.18 release - the following yaml files for exposing Grafana outside the cluster, by allowing anonymous access
apiVersion: v1
kind: ConfigMap
metadata:
  name: grafana-custom-config
  namespace: knative-monitoring
  labels:
    serving.knative.dev/release: "v0.11.0"
data:
  custom.ini: |
    # You can customize Grafana via changing the context of this field.
    [auth.anonymous]
    # enable anonymous access
    enabled = true
    [security]
    allow_embedding = true
    [server]
    root_url = "/grafana"
    serve_from_sub_path = true
apiVersion: networking.istio.io/v1alpha3
kind: VirtualService
metadata:
  name: grafana
  namespace: knative-monitoring
spec:
  gateways:
  - kubeflow/kubeflow-gateway
  hosts:
  - '*'
  http:
  - match:
    - uri:
        prefix: /grafana/
    route:
    - destination:
        host: grafana.knative-monitoring.svc.cluster.local
        port:
          number: 30802
apiVersion: security.istio.io/v1beta1
kind: AuthorizationPolicy
metadata:
  name: models-web-app
  namespace: kubeflow
spec:
  action: ALLOW
  rules:
  - from:
    - source:
        principals:
        - cluster.local/ns/istio-system/sa/istio-ingressgateway-service-account
  selector:
    matchLabels:
      kustomize.component: kserve-models-web-app
      app.kubernetes.io/component: kserve-models-web-app
Note
If you installed the app in the standalone mode then you will need to instead use the knative-serving/knative-ingress-gateway Ingress Gateway and deploy the AuthorizationPolicy in the kserve namespace instead.After applying these YAMLs, based on your installation mode, and ensuring the Grafana instance is exposed under /grafana the web app will show the METRICS tab.

Architecture
The web app includes the following resources:
- A
Deploymentfor running the backend server, and serving the static frontend files - A
Servicefor configuring the incluster network traffic - A
ServiceAccountandClusterRole{Binding}to give the necessary permissions to the web app’s Pod - A
VirtualServicefor exposing the app via the cluster’s Istio Ingress Gateway
SubjectAccessReviews
The web app has a mechanism for performing authentication and authorization checks, to ensure that user actions are compliant with the cluster’s RBAC, which is only enabled in the kubeflow manifests of the app.
This mechanism can be toggled by leveraging the APP_DISABLE_AUTH: "True" | "False" ENV Var.
This mechanism is only enabled in the kubeflow manifests since in a Kubeflow installation all requests that end up in the web app’s Pod will also contain a custom header that denotes the user. In a Kubeflow installation there’s an authentication component in front of the cluster that ensures only logged in users can access the cluster’s services. In the standalone mode such a component might not always be deployed.
The web app will be using the value from this custom header to extract the name of the K8s user that made the request. Then it will create a SubjectAccessReview to check if the user has permissions to perform the specific action, for example deleting an InferenceService in a namespace.
Tip
If you are port-forwarding the app via kubectl port-forward then you will need to set APP_DISABLE_AUTH=“True” in the web app’s Deployment. When port-forwarding the authentication header will not be set, which will result in the web app raising 401 errors.Namespace selection
Both in standalone and in kubeflow setups the user needs to be able to select a Namespace in order to interact with the InferenceServices in it.
In standalone mode the web app will show a dropdown that will show all the namespaces to the user and allow them to select any of them. The backend will make a LIST request to the API Server to get all the namespaces. In this case the only authorization check that takes place is in the K8s API Server that ensures the web app Pod’s ServiceAccount has permissions to list namespaces.
In kubeflow mode the Central Dashboard is responsible for the Namespace selection. Once the user selects a namespace then the Dashboard will inform the iframed Models web app about the newly selected namespace. The Models web app itself won’t expose a dropdown namespace selector in this mode.
Feedback
Was this page helpful?
Thank you for your feedback!
We're sorry this page wasn't helpful. If you have a moment, please share your feedback so we can improve.